
Why not all tech stocks are benefiting from the AI boom
For Australian investors with a keen interest in markets – and technology shares in particular – the past 12 months haven’t exactly been straightforward.

On one hand, U.S. tech stocks are hitting record highs, with headlines dominated by surging chipmakers, massive AI investment, and trillion-dollar companies getting even bigger.
On the other, parts of the technology universe, particularly software and digital marketplaces, are telling a very different story. ASX-listed businesses like Xero and CAR Group are well off their highs, and the same can be said for global names like Salesforce and ServiceNow.
So what’s going on here? And does this divergence mean investors should rotate into the winners and chase momentum?
The answer isn’t that simple and understanding why is key to making sense of the opportunity in front of investors.
4 things investors should understand about the AI-driven tech rally
1. The tech sector is no longer one trade
One of the biggest changes in markets over the past few years is that “technology” no longer moves as one.
What sits under that label today is a collection of very different businesses spanning semiconductors, hardware, cloud infrastructure, software and more – each with their own drivers and role in the AI value chain.
They may be tied to the same theme, but they don’t share the same business model – and that’s why their share prices don’t move in sync. You can see it in the numbers: in the 12 months to 31 March, semiconductor stocks surged nearly 80%, global tech rose 20%, while North American software fell 10.5% and Australian software dropped more than 20%¹.
Even within the Magnificent 7, the differences are stark. These companies span everything from cloud computing and digital marketplaces to consumer devices and enterprise software, with revenue streams that vary widely across their operations.
The Magnificent 7’s melting pot of revenue streams
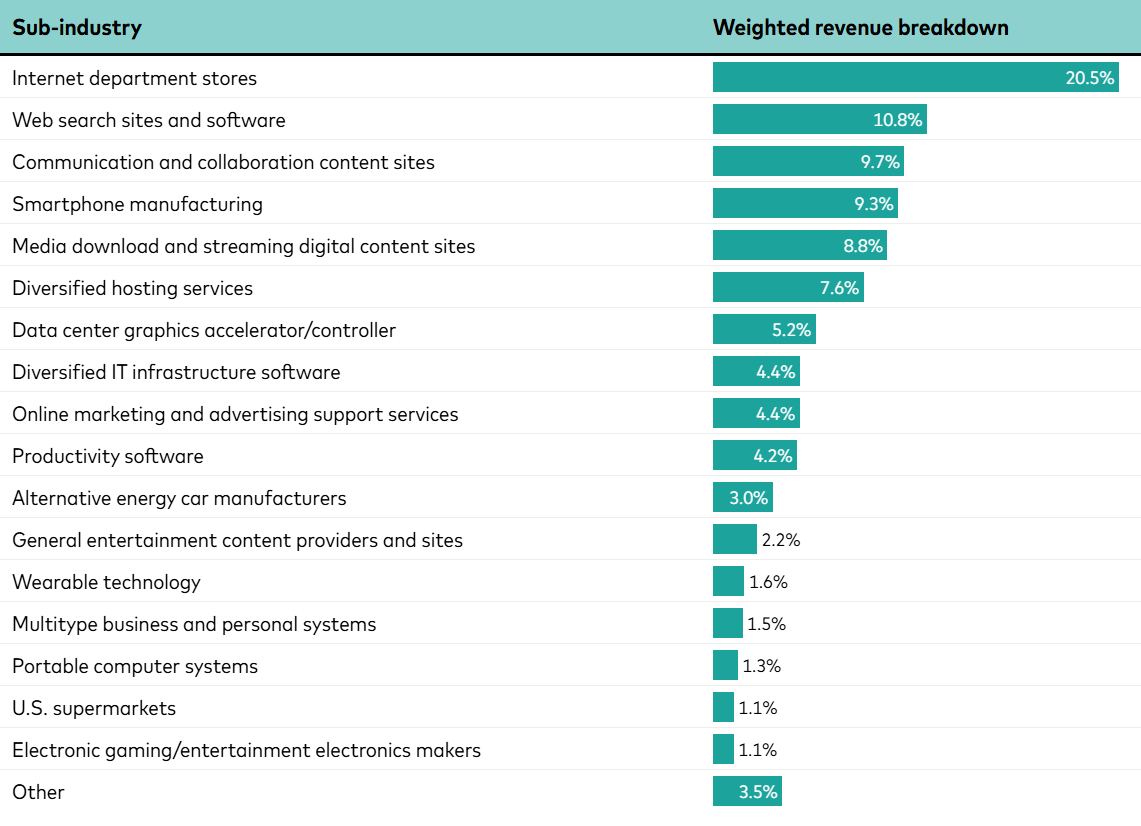
Notes: Weighted revenue breakdown is the proportion of combined revenues attributed to a given source. It is determined by aggregating the revenue from each source across companies and then dividing this figure by the total revenue from all companies combined. Revenues are based on the company’s reported annual fiscal year total revenue for 2025. Sum may not total 100% due to rounding. Sources: Vanguard calculations, based on data from FactSet, as of January 2026.
Footnote:
1. Performance figures are derived from the PHLX Semiconductor Sector Index (USD), FTSE All-World Technology 300 Capped Net Tax Index (unhedged), S&P North American Expanded Technology Software Index (USD), and S&P/ASX All Technology Index (AUD).
2. The early winners are the companies building AI
Before AI can deliver on its long-term promise, it needs to be built and that requires enormous investment in chips, data centres, and computing power. That’s where a significant portion of capital is going today, with estimates pointing to as much as US$2.1 trillion in AI investment commitments through to 2027.
As a result, the companies supplying that infrastructure – the “picks and shovels” of the AI boom – are seeing the benefits first. Strong demand for semiconductors and cloud capacity is translating into earnings growth, supporting the performance of companies such as Nvidia, TSMC and Micron.
By contrast, much of the software layer is still earlier in the cycle. While AI is being integrated into products and workflows, many companies are still working through how to monetise it, with growing questions around pricing and the durability of their business models.
$2.1 trillion for AI capital investment: The AI scalers are good for it
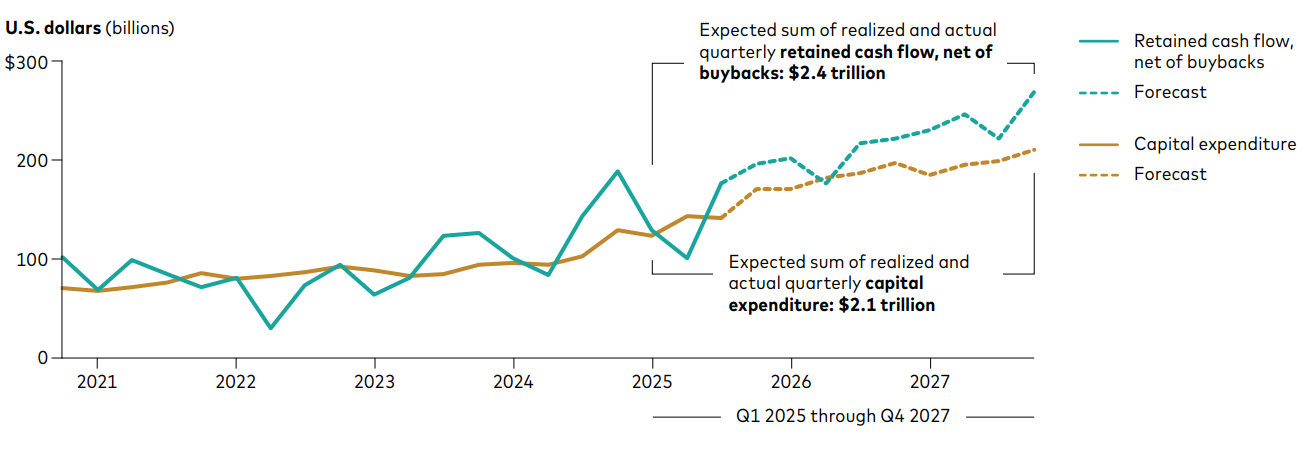
Notes: This chart shows historical and consensus estimates for capital expenditure and retained cash flow minus buybacks for AI scalers (see footnote 1 for definition). The US$2.1 trillion in capital expenditure represents the sum of realized and actual quarterly capital expenditure in the chart from the beginning of 2025 to the end of 2027. Source: Bloomberg, as of November 5, 2025.
3. Today’s winners won’t necessarily stay that way
The current wave of AI investment is following a similar pattern as past technological revolutions – from the great railroad buildout of the 1840s to the internet boom of the 1990s – where economies go through a period of heavy upfront investment before the real productivity gains show up.
Recent research suggests the current AI buildout is still in its early stages, at around 30% to 40% of past investment cycles, with the bulk of spending and the economic impact still ahead.
This is important because in previous cycles, the companies that benefited the most early weren’t always the ones that delivered the best long-term returns.
The early phase tends to be dominated by the businesses building the infrastructure, while the later phase shifts to the adopters – the companies that use the technology to drive productivity and boost profits.
The AI investment cycle is ramping up faster than expected
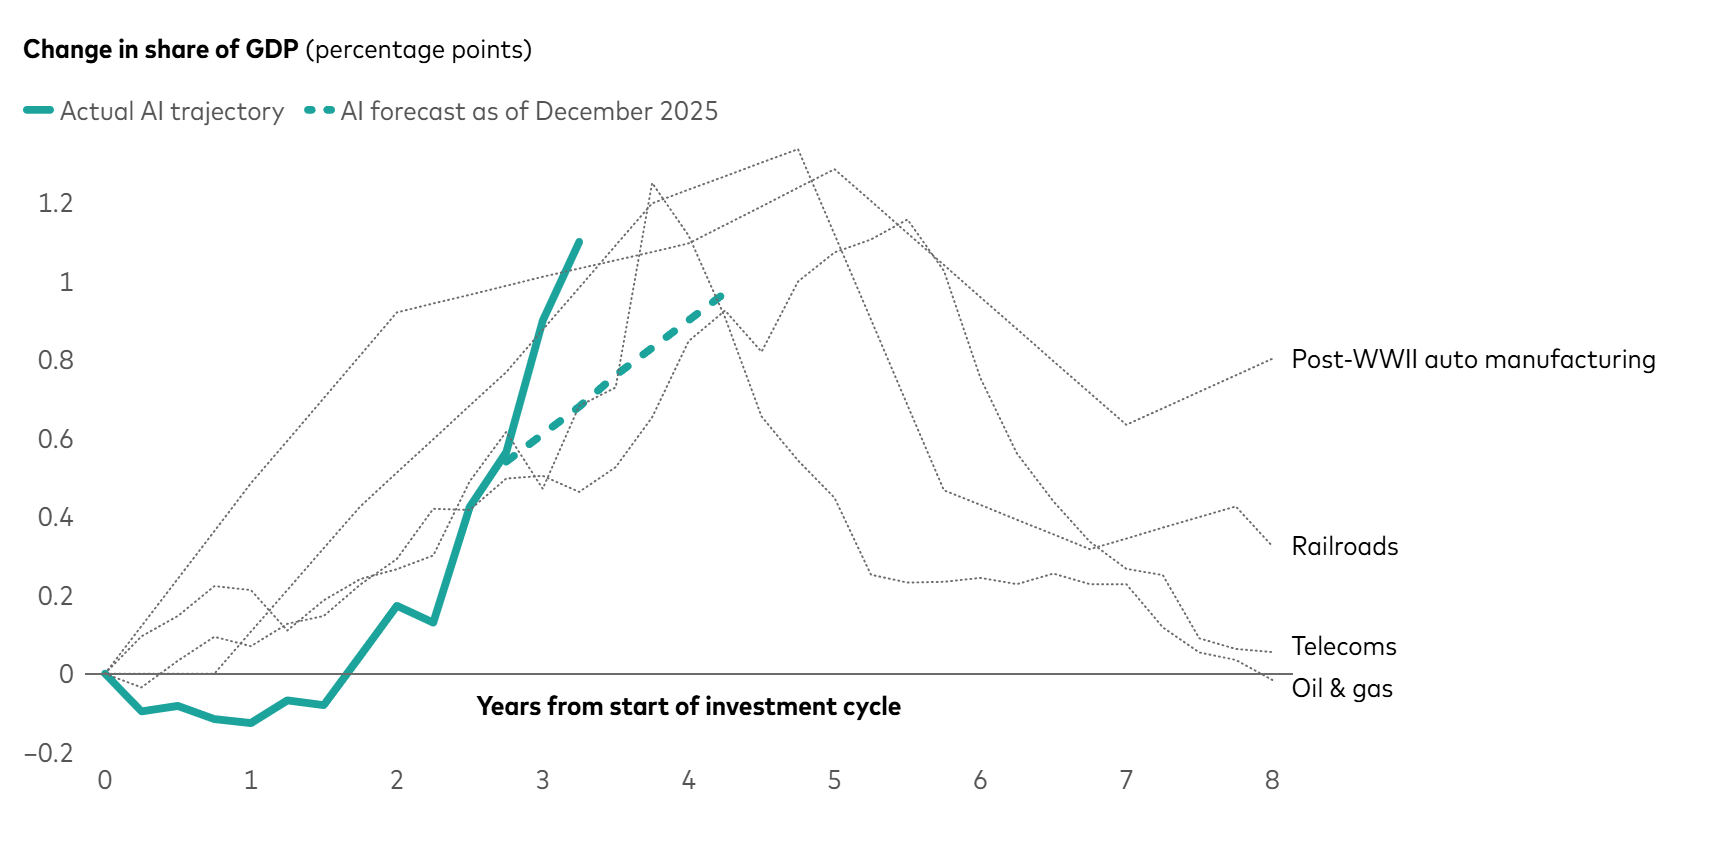
Notes: This chart shows the change in the total size of different investment cycles as a share of real GDP. The period starting points are: Q1 1850 for railroads, Q1 1946 for post-WWII auto manufacturing, Q1 1980 for oil & gas, Q2 1995 for telecoms, and Q3 2022 for AI. Sources: Vanguard calculations, based on data from the U.S. Bureau of Economic Analysis, as of April 30, 2026. Railroad data are sourced from Rui M. Pereira, William J. Hausman, and Alfredo Marvão Pereira, Railroads and Economic Growth in the Antebellum United States, The College of William & Mary, 2014, available at economics.wm.edu/wp/cwm_wp153.pdf.
4. The benefits of AI are likely to extend beyond tech
While AI adoption today is uneven, the potential impact is far wider as it spreads across the economy.
Across industries, a meaningful share of working time could be automated or enhanced using existing AI capabilities, pointing to productivity gains that extend well beyond the current group of AI leaders.
Instead of being concentrated in the companies building the infrastructure, the gains may increasingly flow to the businesses using it most effectively – boosting margins, lowering costs, and driving earnings.
In that environment, a broader set of companies and sectors outside tech stand to benefit from adoption without needing to commit the same level of capital.
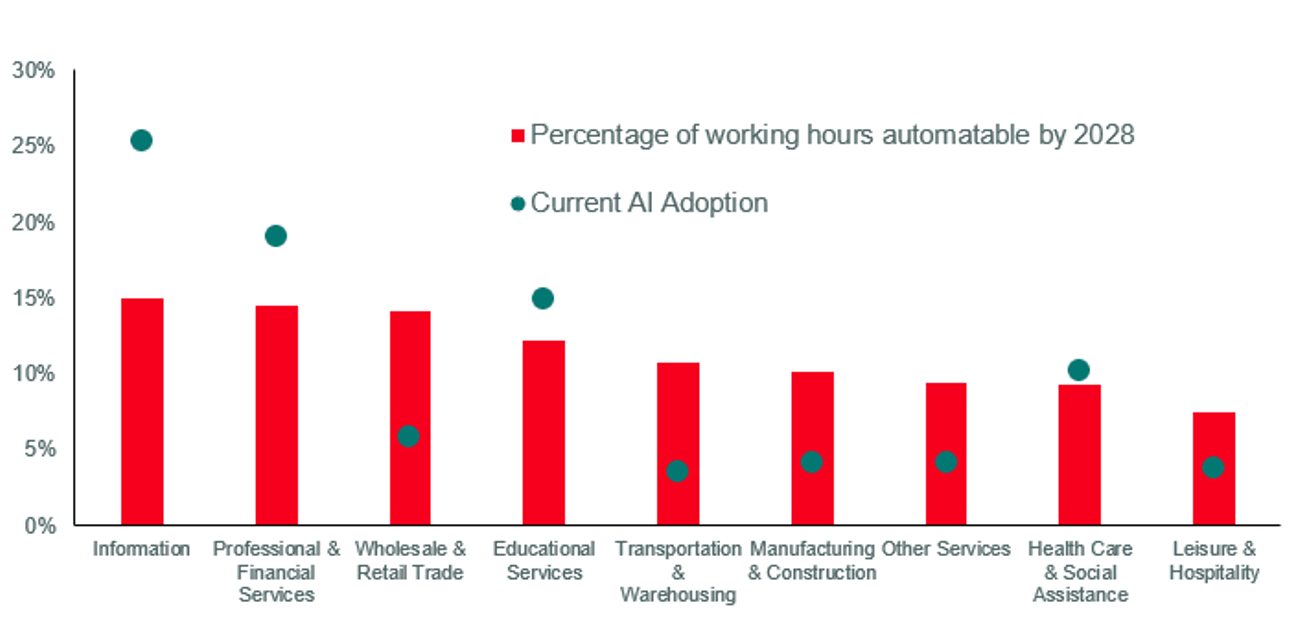
Notes: Automatable working hours are defined as the time spent on tasks that current AI systems could perform at satisfactory proficiency with moderate human supervision. Adjustments are made for tasks that involve face-to-face customer interaction, people leadership, and healthcare decisions. Sources: Vanguard calculations based on data from O*NET Database, Macrobond, U.S. Census Bureau, Bureau of Labor Statistics. Data as of 8/31/2025.
What does it mean for investors?
It can be tempting to chase the hottest parts of the market – like semiconductors and data centre infrastructure – but that can increase concentration risk toward one part of the AI story, while also relying on getting the timing right. And it’s very difficult to know when leadership will shift or where capital will flow next as the cycle evolves.
A more balanced approach may be to maintain exposure across the different parts of the technology ecosystem as part of a diversified portfolio.
Funds such as the Vanguard Global Technology ETF (ASX:VTEK) provide access to a broad range of global technology companies, capturing multiple sources of growth within the sector rather than relying on a single theme.
At the same time, it’s worth recognising that the impact of AI is unlikely to be confined to technology alone. Exposure to companies that may benefit from productivity improvements across the broader economy can also play a role.
The Vanguard Global Active Value ETF (ASX:VVLU) focuses on global value businesses, many that could benefit from increased AI adoption.
Important Information:
This article contains certain ‘forward looking’ statements. Forward looking statements, opinions and estimates provided in this article are based on assumptions and contingencies which are subject to change without notice, as are statements about market and industry trends, which are based on interpretations of current market conditions. Forward-looking statements including projections, indications or guidance on future earnings or financial position and estimates are provided as a general guide only and should not be relied upon as an indication or guarantee of future performance. There can be no assurance that actual outcomes will not differ materially from these statements. To the full extent permitted by law, Vanguard Investments Australia Ltd (ABN 72 072 881 086 AFSL 227263) and its directors, officers, employees, advisers, agents and intermediaries disclaim any obligation or undertaking to release any updates or revisions to the information to reflect any change in expectations or assumptions.
All investing is subject to risk, including the possible loss of the money you invest. Diversification does not ensure a profit or protect against a loss in a declining market. Be aware that fluctuations in the financial markets and other factors may cause declines in the value of your account. There is no guarantee that any particular asset allocation or mix of funds will meet your investment objectives or provide you with a given level of income.
Vanguard Investments Australia Ltd (ABN 72 072 881 086 / AFS Licence 227263) (VIA) is the product issuer and operator of Vanguard Personal Investor. We have not taken your or your clients’ objectives, financial situation or needs into account when preparing this article so it may not be applicable to the particular situation you are considering. You should consider your objectives, financial situation or needs, and the disclosure documents for the product before making any investment decision. Before you make any financial decision regarding the product, you should seek professional advice from a suitably qualified adviser. A copy of the Target Market Determinations (TMD) for Vanguard’s financial products can be obtained on our website free of charge, which includes a description of who the financial product is appropriate for. You should refer to the TMD of the product before making any investment decisions. You can access our Investor Directed Portfolio Service (IDPS) Guide, Product Disclosure Statements (PDS), Prospectus and TMD at http://vanguard.com.au and Vanguard Super SaveSmart and TMD at http://vanguard.com.au/super or by calling 1300 655 101.
Past performance information is given for illustrative purposes only and should not be relied upon as, and is not, an indication of future performance. This article was prepared in good faith and we accept no liability for any errors or omissions.
© 2026 Vanguard Investments Australia Ltd. All rights reserved.
Source: Vanguard
Reproduced with permission of Vanguard Investments Australia Ltd
Vanguard Investments Australia Ltd (ABN 72 072 881 086 / AFS Licence 227263) is the product issuer. We have not taken yours and your clients’ circumstances into account when preparing this material so it may not be applicable to the particular situation you are considering. You should consider your circumstances and our Product Disclosure Statement (PDS) or Prospectus before making any investment decision. You can access our PDS or Prospectus online or by calling us. This material was prepared in good faith and we accept no liability for any errors or omissions. Past performance is not an indication of future performance.
© 2022 Vanguard Investments Australia Ltd. All rights reserved.
Important:
Any information provided by the author detailed above is separate and external to our business and our Licensee. Neither our business nor our Licensee takes any responsibility for any action or any service provided by the author. Any links have been provided with permission for information purposes only and will take you to external websites, which are not connected to our company in any way. Note: Our company does not endorse and is not responsible for the accuracy of the contents/information contained within the linked site(s) accessible from this page.